
Last summer we went hiking in Saxon Switzerland. Near the Königstein Fortress we stopped for a picnic under a large rock shelter a bit off the hiking trail. Of course we were not the first people to visit this rock shelter, and some of the previous visitors had left grafitti. The older grafitti are incised into the sandstone rock, and the younger grafitti are (fortunately) only written with felt pens. The oldest clearly legible grafitti dates from 1813, the youngest clearly legible one dates from 2010.
It is always good to test methods using real-world test cases, so I thought I’d try to document some of the grafitti with a number of overlapping photographs and later throw them into a structure-from-motion process to create a 3D model from the photographs and to see how well some of the incised grafitti could be captured in such a 3D approach.
Outside, it was a bright summer afternoon. Under the rock shelter, lighting was poor, and the camera’s automatic exposure settings resulted in ISO 640 – not really great if you want to do something with the images. As I didn’t have a tripod with me, it was either this or risk blurred images (some of them were slightly blurred nonetheless). I ended up with 17 photographs which I processed with Agisoft Photoscan. At highest quality settings, the resulting 3D point cloud contained roughly 150 million points.
I also exported a low-resolution meshed model and loaded this into MeshLab to measure three different points which I wanted to use to define a “base plane”. Using the XYZ coordinates of these three points, I then rotated the point cloud in a way that these points defined a new XY plane. This had to be done because Photoscan defines an arbitrary coordinate system where you don’t have control over how the 3D model is oriented in space. I then used the rotated point to create a gridded data set (i.e. a DEM-like raster map) and an orthophoto texture map of the photographed part of the rock shelter’s wall. As I didn’t measure anything, scaling is based on guessing the size of the panel. Of course, any error at this point will also affect the depth values.

Orthophoto texture created from vertex colour data of the dense 3D point cloud.
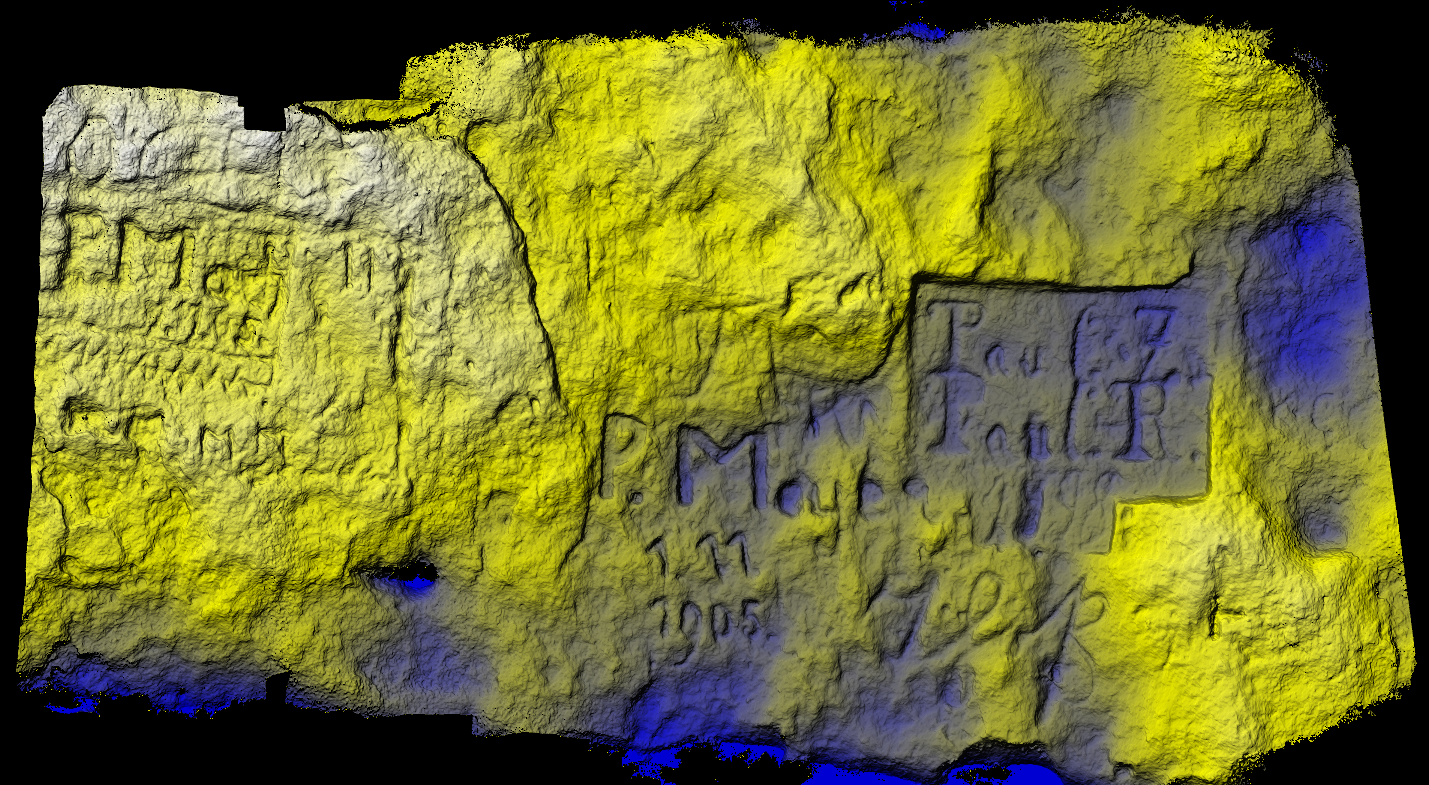
Shaded relief image (with colour-coding to indicate depth) created from the DEM-like raster map. Colour-coded depth ranges from -3 cm (blue) to +3 cm (white).
Because I have been testing multiple DEM visualisation techniques anyway, I wanted to see whether these could help to create a clearer picture of the incised grafitti. Besides the colour-coded shaded relief image I tested sky-view factor, trend removal, local dominance and multi-scale integral invariants (MSII). The latter three visualisation techniques are all well-suited to visualise surface detail, with local dominance perhaps slightly clearer (less noisy) than MSII and trend removal.

Sky-biew factor visualisation (computed using LiVT).

Trend removal visualisation (computed using LiVT).

MSII visualisation (computed using LiVT).

Local dominance visualisation (computed using LiVT).
The three last visualisation techniques, and inparticular local dominance visualisation, greatly enhance visibility of grafitti incised into the rock surface. It appears that a certain P. Meyer visited the rock shelter not only on the first of November 1905, but also on the first of November 85 – likely 1885. We can now also clearly see that someone had started outlining a rectangular area in the left part of the panel: numerous gouging marks are clearly visible in local dominance visualisation but very difficult to discern in the orthophoto.
To conclude, despite the more or less haphazard approach at photographing the panel and the sub-optimal image quality (high ISO and slight blurring), the results look promising. Under improved image acquisition conditions (tripod, low ISO etc.), a structure-from-motion approach can certainly be very useful for documenting rock carvings.
References
Imhof, E., 2007. Cartographic relief representation. English language edition edited by H.J. Steward. Redlands: ESRI Press.
Mara, H., Krömker, S., Jakob, S., Breuckmann, B., 2010. GigaMesh and Gilgamesh – 3D Multiscale Integral Invariant Cuneiform Character Extraction, in: A. Artusi, M. Joly-Parvex, G. Lucet, A. Ribes u. D. Pitzalis (Hg.), The 11th International Symposium on Virtual Reality, Archaeology and Cultural Heritage VAST (Paris, France, 2010), 131–138.
Zakšek, K. Oštir, K., Kokalj, Z., 2011. Sky-View Factor as a relief visualisation technique. Remote Sensing 3, 398–415.

Very interesting work again!